Dashboard and Control Panels for Your Data
Turn raw data into winning decisions. Interactive dashboards and real-time reports to constantly measure company performance.
Data Integration and Centralized Data Warehousing
Modern companies accumulate gigabytes of data in isolated silos: ERP systems, CRM platforms, marketing tools, and Excel spreadsheets. Our Business Intelligence (BI) solution aggregates these sources into a single secure Data Warehouse, cleaning and normalizing the information.
This process guarantees a single source of truth for the entire company, eliminating discrepancies between reports from different departments and providing a solid and reliable database.

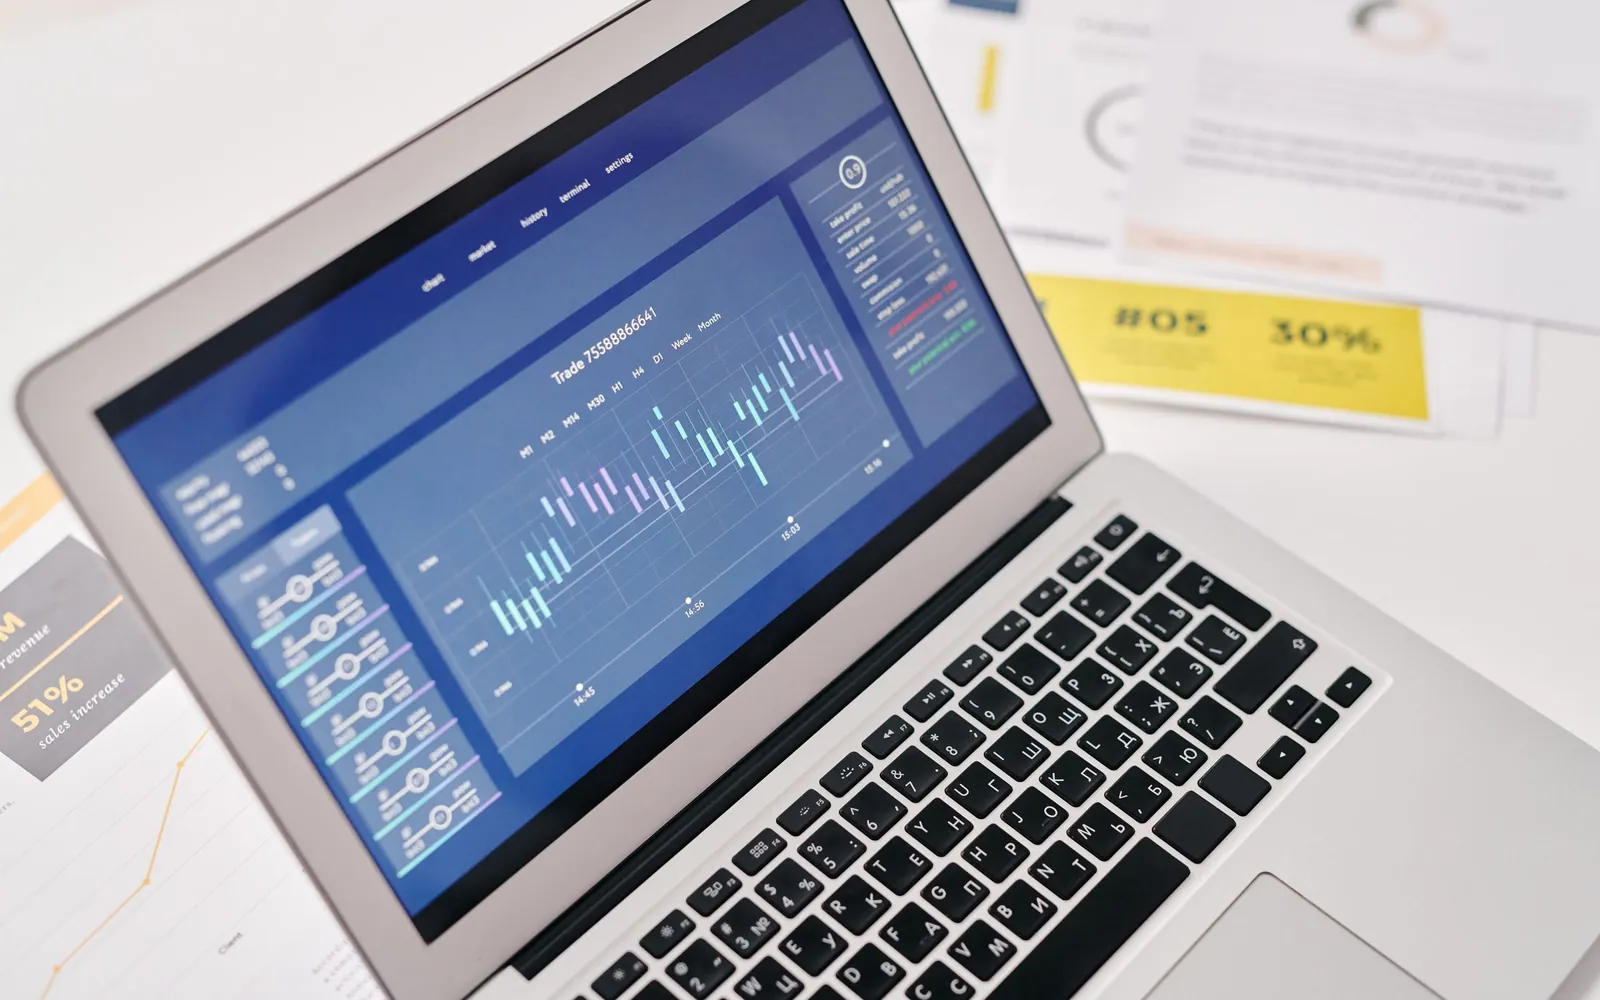
Visual KPIs and Advanced Data Visualization
Visualize your business progress through interactive charts, dynamic pivot tables, and real-time Key Performance Indicators (KPIs). Thanks to drill-down features, you can switch in one click from a general overview of company revenue to the details of a single transaction or agent performance.
We design the user interface (UI/UX) to be extremely intuitive, reducing the time required for managers to interpret graphs and identify anomalies or positive trends to zero.

Automated Reporting and Secure Sharing
Stop wasting valuable employee hours extracting data manually and creating slides at the end of the month. Our system generates automated PDF reports and emails them to selected recipients according to scheduled deadlines.
Additionally, we implement granular access levels to allow commercial partners, distributors, or external agents to view only the data and charts relevant to them, respecting privacy policies.

Demonstration example with simulated data
Demonstration example with simulated data
Revenue vs Budget Performance (in € thousands)
Operating Costs Distribution
Recent Business Intelligence Projects Delivered
| Project ID | Client | Data Integration | Status | Delivery Time |
|---|---|---|---|---|
| #BI-3310 | Finance & Co. S.p.A. | SAP ERP + Salesforce BI | Completed | 4 weeks |
| #BI-3311 | Logistica Italia S.r.l. | Warehouse KPIs & Tracking | In Progress | 6 weeks |
| #BI-3312 | Ecommerce Hub | GA4 + Shopify + Meta Ads | Completed | 3 weeks |
Integration and Release Timeline
Analyzing your data silos, designing the centralized database, and creating interactive BI dashboards takes on average between 4 and 8 weeks. Our team designs modular solutions that release partial reports in the early stages of development, guaranteeing you a fast and continuous return on investment.
Ready to transform your company data into immediate strategic decisions?

The Power of Visual Data
Business Intelligence (BI) extracts information from disconnected sources (management software, spreadsheets, web analytics) to offer you a clear overview.

Data Integration
We connect all company data sources via API. We create a solid Data Warehouse that normalizes data before visualization.
Real-Time KPIs and Metrics
Always updated charts, pivot tables, and performance indicators. Discover trends, anomalies, and opportunities with a few clicks.
Automated Reporting
Stop going crazy with data extraction and copy-paste. Set up PDF reports automatically sent via email to management every Monday morning.
Learn more for your sector
Explore software solutions tailored for vertical operational sectors
Show index of industries and business activities
Frequently Asked Questions
What BI tools do you use?
We develop custom dashboards in Angular/React for maximum fluidity, or integrate consolidated platforms such as Power BI, Metabase, or Tableau.
Can I view historical data?
Certainly, BI is designed specifically to analyze historical series, compare quarters, and calculate variations (Year Over Year, Month Over Month).
Are dashboards accessible externally?
We can create specific portals (Customer Portal or Partner Portal) to securely share report subsets with clients, suppliers, or external agents.